Author: Harry Sit
Go to Source
[Updated with law changes and the new spreadsheet version for 2021.]
Most online tax calculators don’t include the effect on the premium tax credit when you get health insurance under the Affordable Care Act (ACA), also known as Obamacare. This is a major gap for millions of people who get a subsidy for health insurance from the ACA because their income affects the amount of subsidy they will receive. Getting a larger subsidy reduces their tax dollar for dollar; qualifying for less subsidy increases their tax dollar for dollar.
The most accurate way to project taxes is to use downloaded tax software. However, tax software for the current year won’t be available until November or December. The American Rescue Plan Act of 2021 changed the ACA subsidy in 2021 and 2022 from a cliff to a slope. My favorite tool for tax planning is the Case Study Spreadsheet, which is created and updated by MDM on the Mr. Money Mustache forum. MDM releases several updates each year to add new features and keep up with tax law changes. The Case Study Spreadsheet already reflects changes made in the American Rescue Plan Act.
It’s an actual spreadsheet file, not an online one. You will need Microsoft Excel or compatible software to open it. As with anything downloaded from the Internet, you will have to trust the source. The author MDM puts a lot of work into this spreadsheet. I was invited to test it. As far as I can tell, it’s reasonably accurate.
With 17 tabs, this spreadsheet does a lot of things. It looks overwhelming if you are only looking for one feature out of many. I will show you how this spreadsheet can help calculate the effect of Roth conversion or realizing long-term capital gains when you also receive a subsidy for your ACA health insurance. I used version 21.09 released on July 11, 2021.
Scenario
A retired couple, both age 60, Nevada residents, married filing jointly, with no dependents. They live on $40k pension income and $5k qualified dividends. They have no other income or deductions. The full price of the second lowest cost Silver plan from the ACA marketplace is $2,000/month. They chose that plan, paying $250/month out of pocket. The government pays $1,750/month directly to the insurance company as an advance subsidy.
Their questions:
- How does it affect their taxes if they convert additional money from their traditional IRA to Roth?
- How does it affect their taxes if they realize some long-term capital gains?
The Spreadsheet
After you download the spreadsheet, make a copy of it. Because you’ll make changes in many places in the spreadsheet, it’s better to keep an unedited copy when you need to start over completely to model different inputs. Open the copy in Microsoft Excel or a compatible program. Click on Enable Editing and Enable Content in the yellow ribbon you see in Excel.
Go to the Calculations tab. First, you enter your filing status, your number of dependents, and your ages starting at cell G2.
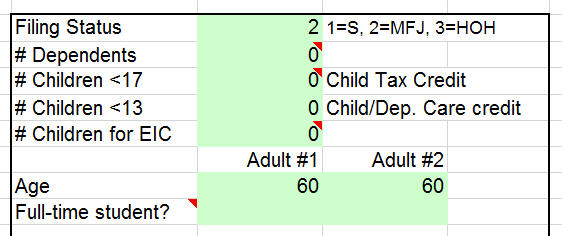
You go down to cell H35 to enter your state of residency.

Next, you enter your income. Because the couple in our scenario are both retired, we skip the paycheck items and we go down to the non-paycheck income starting at cell D23. You only input into cells highlighted in green. Use annual numbers here.
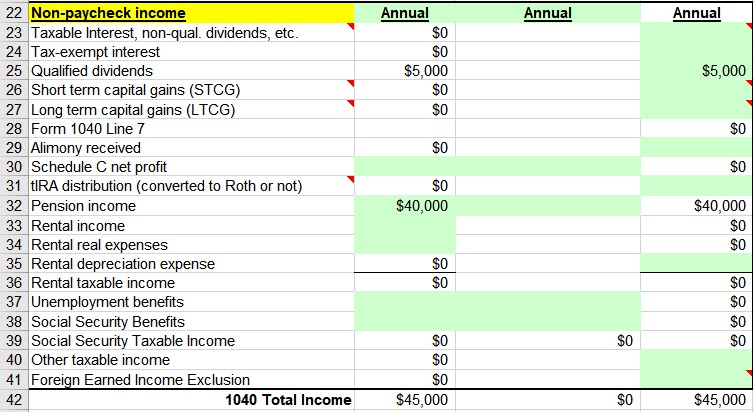
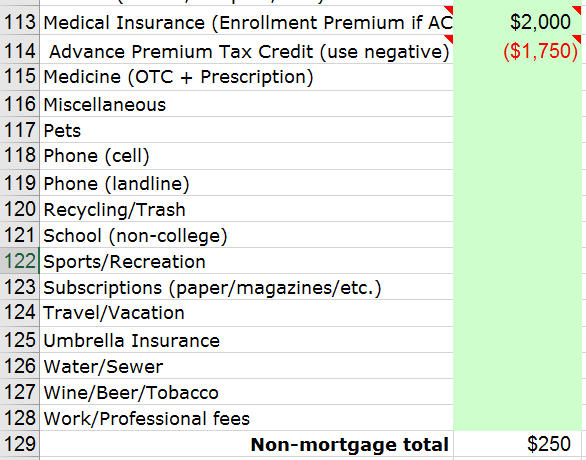
Then you go down to the monthly average expense section and enter the full price of the health insurance premium and the advance subsidy in cells B113 and B114. Remember to enter the monthly numbers here. Enter the advance subsidy amount as a negative number. If you mouse over cells B113 and B114, you will see some instructions there.
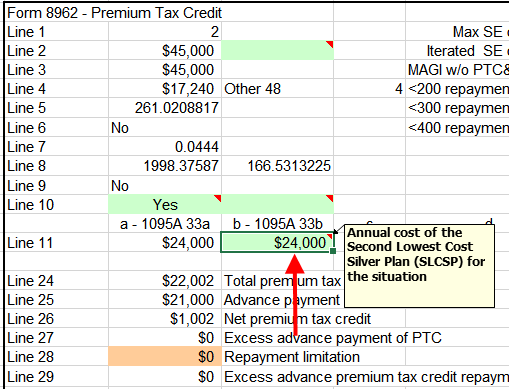
Now scroll to the far right to cell AC88 or use the find function in your spreadsheet software to locate “Form 8962.” Enter the full price of the second lowest cost Silver plan in cell AE100. Use the annual number here. You may notice it shows “Other 48” in 8 rows above. If you live in Alaska or Hawaii, make sure to enter “AK” or “HI” in cell H35.
Finally, we go back to the tax calculation area starting at cell F11. This shows their baseline estimated federal income tax.
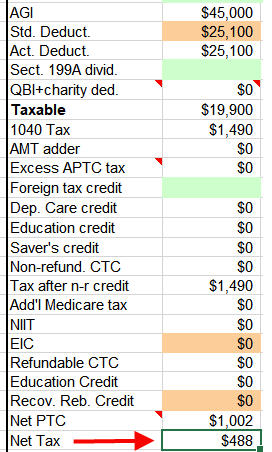
As you see from above, the spreadsheet estimates that this retired couple will pay $1,490 in federal income tax and receive $1,002 in additional ACA premium tax credit on top of the advance credit already paid directly to the health insurance company. With $45,000 in AGI, that’s an average tax rate under 4% before health insurance subsidies. Normally they would be good candidates for converting a part of their traditional IRA to Roth to take advantage of their low tax rate before they start Social Security and before RMDs start.
Roth Conversion
What happens if they do Roth conversions? Now comes the really neat part of this spreadsheet. You see a chart near cell F81.
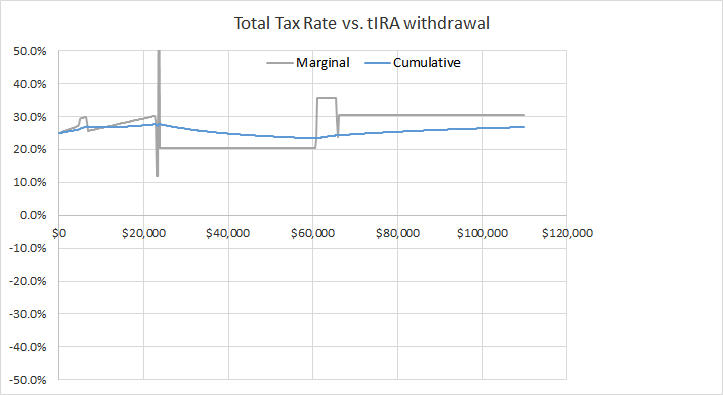
The X-axis represents different amounts in Traditional IRA withdrawals whether the withdrawals are converted to Roth or not. The Y-axis shows the marginal and cumulative tax rate on such withdrawals. The chart for our example shows this couple will pay 25% to 30% tax on their IRA withdrawals (Roth conversions) up to about $22,000. That’s the point when their income hits the 400% Federal Poverty Level (FPL). Their marginal tax rate for additional Roth conversions bounces around a little bit and then it settles down to about 20%. This is because the new law changed the ACA subsidy cliff beyond 400% FPL to a slope. After the slope ramps down to zero, their marginal tax rate on additional Roth conversions gets on a small plateau before it flatlines at about 30% until they convert $110,000.
The couple can decide how much they want to convert based on the marginal tax rates in the chart. If 25% to 30% feels too high, they don’t convert. If they want to convert $20,000, they might as well convert some more because the marginal tax rate comes down between converting $22,000 and converting $60,000.
Long-Term Capital Gains
What happens if instead of Roth conversions they realize some long-term capital gains? We can change the X-axis in the chart from Traditional IRA withdrawals (Roth conversions) to long-term capital gains. The area under the chart tells us how to do that.
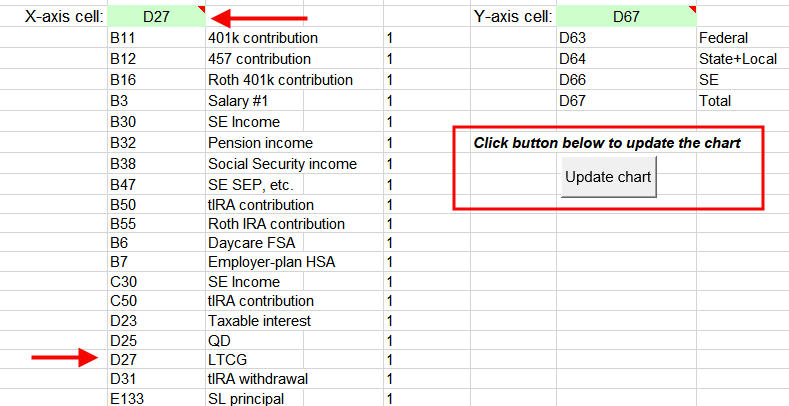
The list tells us Long-Term Capital Gains (LTCG) is D27. So we choose D27 in the dropdown for cell G107. Then we click on that button to update the chart.
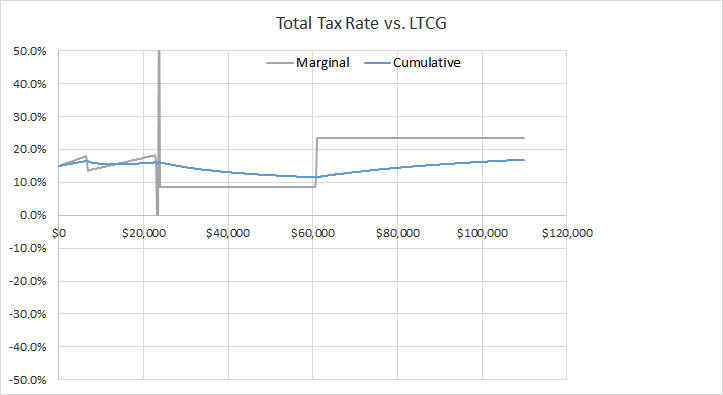
The shape of the chart is similar to the one for Roth conversions but the rates are different. It shows they pay 15% to 18% on realized long-term capital gains up to about $22,000. Then the marginal tax rate goes down to slightly below 10% before a bump to above 20% when they realize more than $60,000 in long-term capital gains.
Again, if 15%-18% feels too high, they shouldn’t realize those gains. If they will already realize $20,000 in long-term capital gains, they might as well realize $40,000 more.
Adjusting the Chart Scale
By default, the Y-axis in the chart goes between -50% and +50%. If we want to use the space in full, we can adjust the Y-axis scale. Select the Y-axis in the chart, right-click, and click on Format Axis… Choose a different number for the minimum and the maximum. It will make the chart easier to see.
The range in the X-axis is adjusted by changing the numbers in cells P83 and P84.

Entering a smaller number in cell P83 will make the chart show a narrower range. Using a larger number will make the chart show a wider range. For example, the Roth conversion chart looks like this after changing the number in P83 from the default 220 to 100 together with adjusting the minimum for the Y-axis from -0.5 to 0.1.
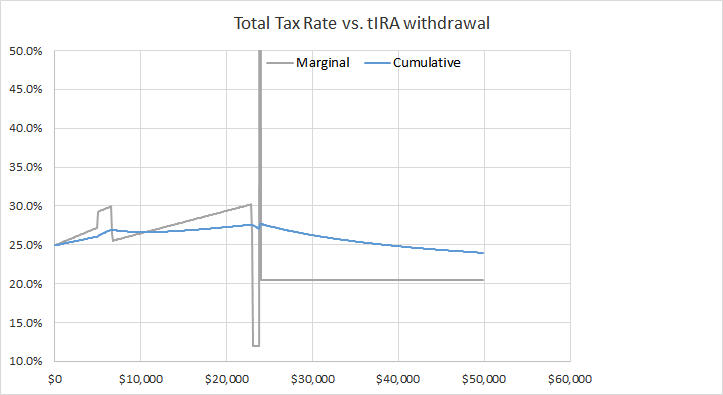
It gives us a closer view of what’s happening for conversions up to $50,000 instead of $100,000. If you want to see what happens if they convert more than $100,000, change the number in cell P83 from 220 to 300 or 400.
***
This exercise shows that converting to Roth or realizing long-term capital gains while receiving the ACA health insurance subsidy incur higher taxes than if you’re not receiving the ACA health insurance subsidy. The Case Study Spreadsheet does a great job of displaying the effect. It has a learning curve when you go all over the place to find the right spot for your inputs and look at the results, but it works wonders once you know where to enter things and what to look for. The interactive chart shows what-if’s better than tax software. I thank MDM for the hard work. The more I use it, the more I’m amazed at how neat the spreadsheet is. It’s my go-to tax planning tool.
Once again, the link to the latest spreadsheet is in the first post by MDM in this thread on the Mr. Money Mustache forum:
https://forum.mrmoneymustache.com/forum-information-faqs/case-study-spreadsheet-updates/
The same spreadsheet can be used to show the effect of Roth conversions without the complications of ACA health insurance. I’ll do an example with Social Security and Medicare in another post.
Learn the Nuts and Bolts
 |
I put everything I use to manage my money in a book. My Financial Toolbox guides you to a clear course of action. |
The post Roth Conversion and Capital Gains On ACA Health Insurance appeared first on The Finance Buff.