Author: Sam Stebbins
Source
Policemen and women are known to have one of the hardest jobs in the country. According to the Bureau of Labor Statistics, they have a higher risk of injuries sustained on the job as well as increased rates of illness. Added to that are the long hours they are often forced to work coupled with irregular shifts – they can be called in at any time and regularly work on holidays and weekends.
In addition, law enforcement officers in the United States are regularly subjected to volatile and potentially dangerous situations. Not only are they at risk of death due to violent situations, but they are also subjected to potential transportation accidents. Due to the nature of their job, police typically carry a firearm, which they are authorized to use in certain circumstances. (Here is a look at the standard issue police sidearm in America’s 10 biggest cities.)
In some circumstances, the use of deadly force is considered valid in cases where a suspect poses an imminent physical threat to an officer or other individuals. These situations are typically when a suspect is believed to pose a threat due to bodily harm or when a suspect may have been involved in a serious crime that has caused serious physical injury.
Generally, police use of deadly force is considered legitimate in cases where a suspect poses an imminent physical threat to an officer or other individuals. However, such determinations are often subjective and open to interpretation – and while some cases are clear-cut, others are not. The Fourth Amendment outlines what is acceptable and what is not, and specifically forbids the use of force against an unarmed suspect who is unarmed and fleeing the scene.
There are certain circumstances where force may be necessary. Should an officer have probable cause that a suspect has committed a violent crime, or if the suspect has threatened an officer, the use of deadly force may be necessary. Not only to prevent a suspect from fleeing the scene but to protect the life of the officer.
However, not every situation is handled properly. An extreme example of the improper police use of deadly force came in 2020 when George Floyd was murdered by an on-duty Minneapolis police officer. Floyd’s murder was the target of widespread media attention and public outrage and put law enforcement agencies across the country under intense scrutiny.
Still, more than 1,000 people are killed by law enforcement every year in the United States, and the majority of those killings are deemed to be justified by oversight officials.
Using data compiled by the research collaborative Mapping Police Violence, 24/7 Wall St. identified the 30 cities with the most police killings. Cities were ranked by the number of people killed by police officers from 2013 through May 2023 for every 100,000 people. To focus on large to mid-size cities, only cities with populations of at least 100,000 were considered. In every city on this list, there were at least 10 people killed by police for every 100,000 city residents – well above the national rate of 3.5 police killings per 100,000 people.
There are 30 cities on this list, where a total of 941 people have been killed by law enforcement since 2013. Of them, 118 were reported to be unarmed and 158 showed signs of a mental illness. Officers involved in those killings, however, are known to have faced consequences – whether professional, civil, or criminal – in only 32 cases. (Here is a look at the states with the most known police killings.)
In each of these cities listed, over 85% of those killed were men. Additionally, while the largest cumulative share of those killed by police in these places was white, in six cities on this list, at least half of all those killed were black, and in four, over half were Hispanic.
Click here to see cities where police have killed the most people since 2013.
30. Shreveport, LA

- Documented police killings, 2013-2023: 10.0 per 100,000 people (19 total)
- Cases where officers are known to have faced professional/criminal/civil consequences: 1
- Gender of those killed: 100% male
- Race/ethnicity of those killed: 26.3% White, 57.9% Black, 5.3% Hispanic, 5.3% Asian, 0% Native American
- Share of those killed with signs of a mental illness: 10.5%
- Share of those killed who were unarmed: 15.8%
- Population: 189,374
29. Knoxville, TN
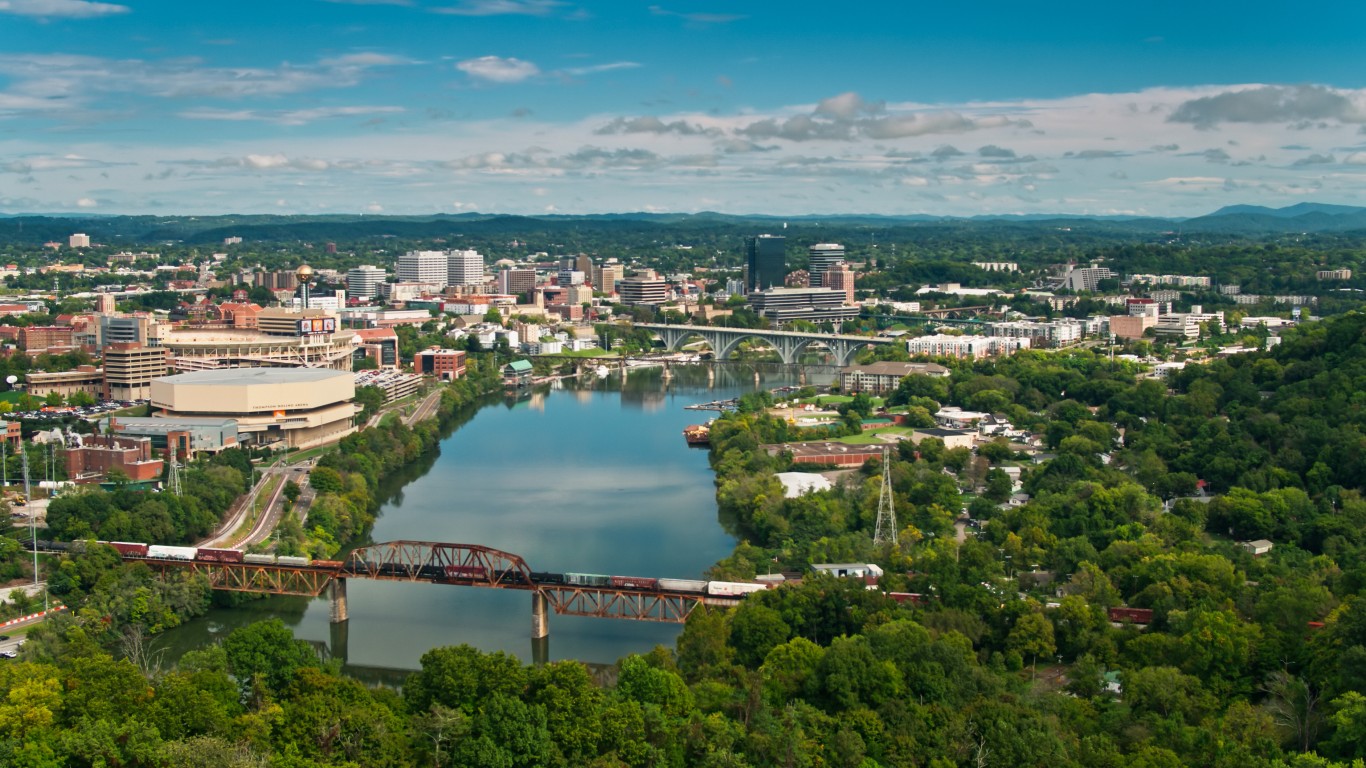
- Documented police killings, 2013-2023: 10.0 per 100,000 people (19 total)
- Cases where officers are known to have faced professional/criminal/civil consequences: 1
- Gender of those killed: 94.7% male, 5.3% female
- Race/ethnicity of those killed: 57.9% White, 26.3% Black, 10.5% Hispanic, 0% Asian, 0% Native American
- Share of those killed with signs of a mental illness: 26.3%
- Share of those killed who were unarmed: 21.1%
- Population: 189,339
28. Kansas CIty, MO
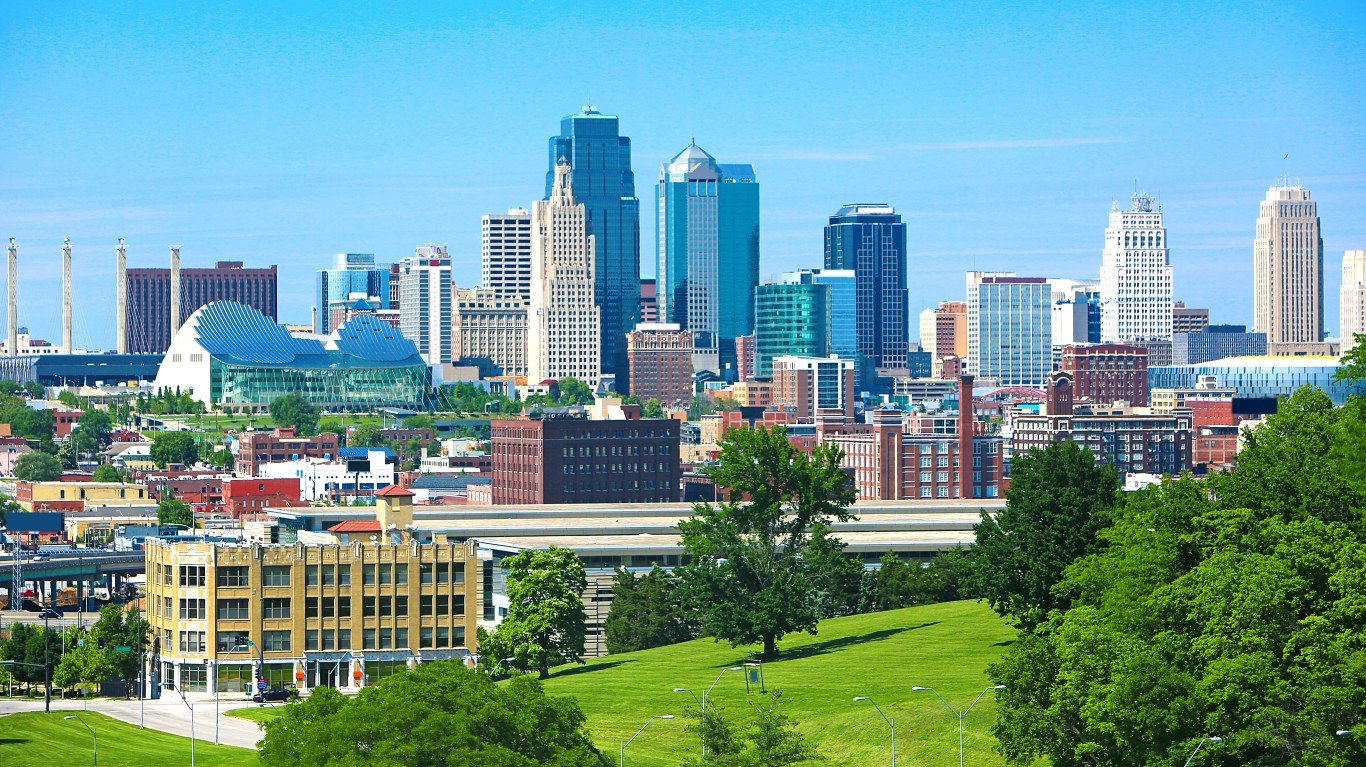
- Documented police killings, 2013-2023: 10.1 per 100,000 people (51 total)
- Cases where officers are known to have faced professional/criminal/civil consequences: 1
- Gender of those killed: 98.0% male, 2.0% female
- Race/ethnicity of those killed: 33.3% White, 45.1% Black, 2.0% Hispanic, 0% Asian, 0% Native American
- Share of those killed with signs of a mental illness: 15.7%
- Share of those killed who were unarmed: 11.8%
- Population: 502,597
27. Westminster, CO
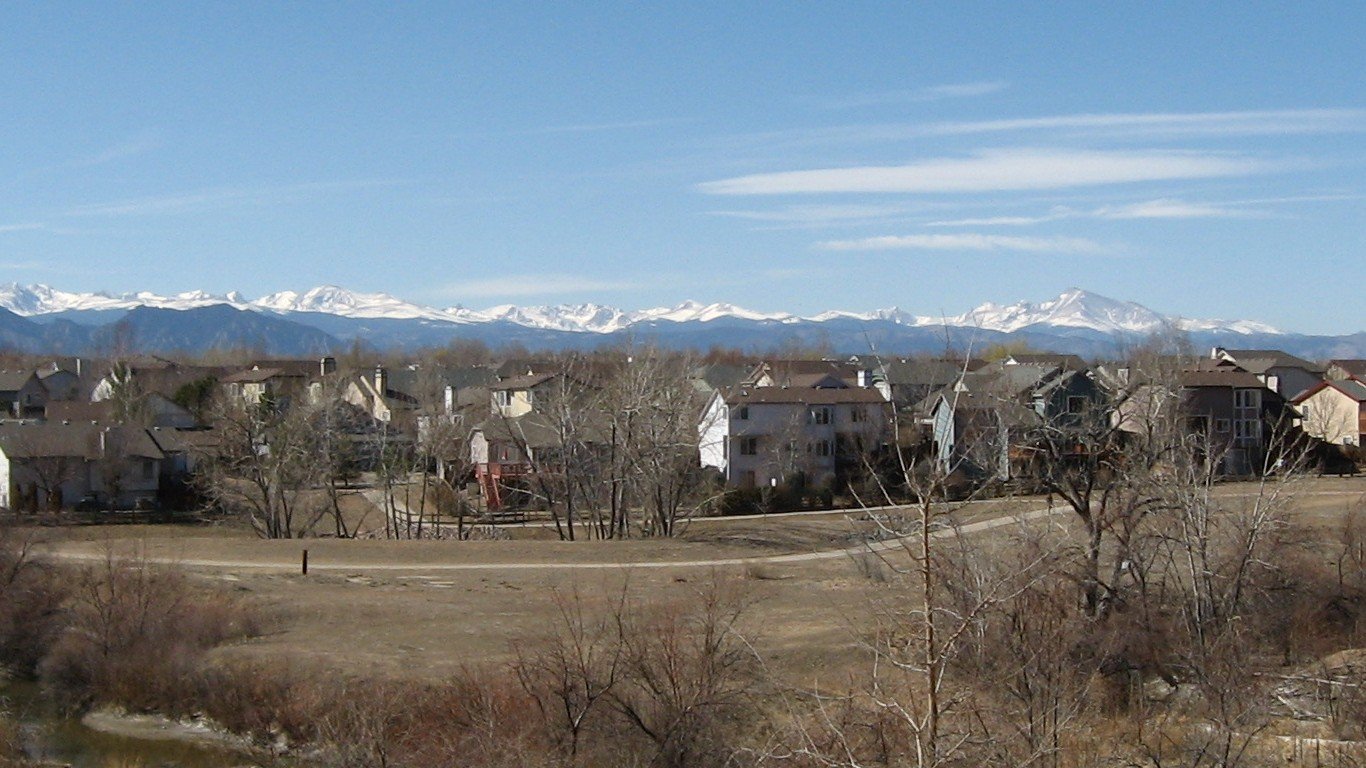
- Documented police killings, 2013-2023: 10.4 per 100,000 people (12 total)
- Cases where officers are known to have faced professional/criminal/civil consequences: 0
- Gender of those killed: 100% male
- Race/ethnicity of those killed: 66.7% White, 0% Black, 16.7% Hispanic, 0% Asian, 0% Native American
- Share of those killed with signs of a mental illness: 0%
- Share of those killed who were unarmed: 8.3%
- Population: 115,535
26. Midland, TX

- Documented police killings, 2013-2023: 10.7 per 100,000 people (14 total)
- Cases where officers are known to have faced professional/criminal/civil consequences: 0
- Gender of those killed: 85.7% male, 14.3% female
- Race/ethnicity of those killed: 35.7% White, 7.1% Black, 35.7% Hispanic, 0% Asian, 7.1% Native American
- Share of those killed with signs of a mental illness: 7.1%
- Share of those killed who were unarmed: 14.3%
- Population: 130,765
25. Birmingham, AL

- Documented police killings, 2013-2023: 10.9 per 100,000 people (22 total)
- Cases where officers are known to have faced professional/criminal/civil consequences: 1
- Gender of those killed: 95.5% male, 4.5% female
- Race/ethnicity of those killed: 36.4% White, 59.1% Black, 4.5% Hispanic, 0% Asian, 0% Native American
- Share of those killed with signs of a mental illness: 4.5%
- Share of those killed who were unarmed: 18.2%
- Population: 202,234
24. Kansas City, KS
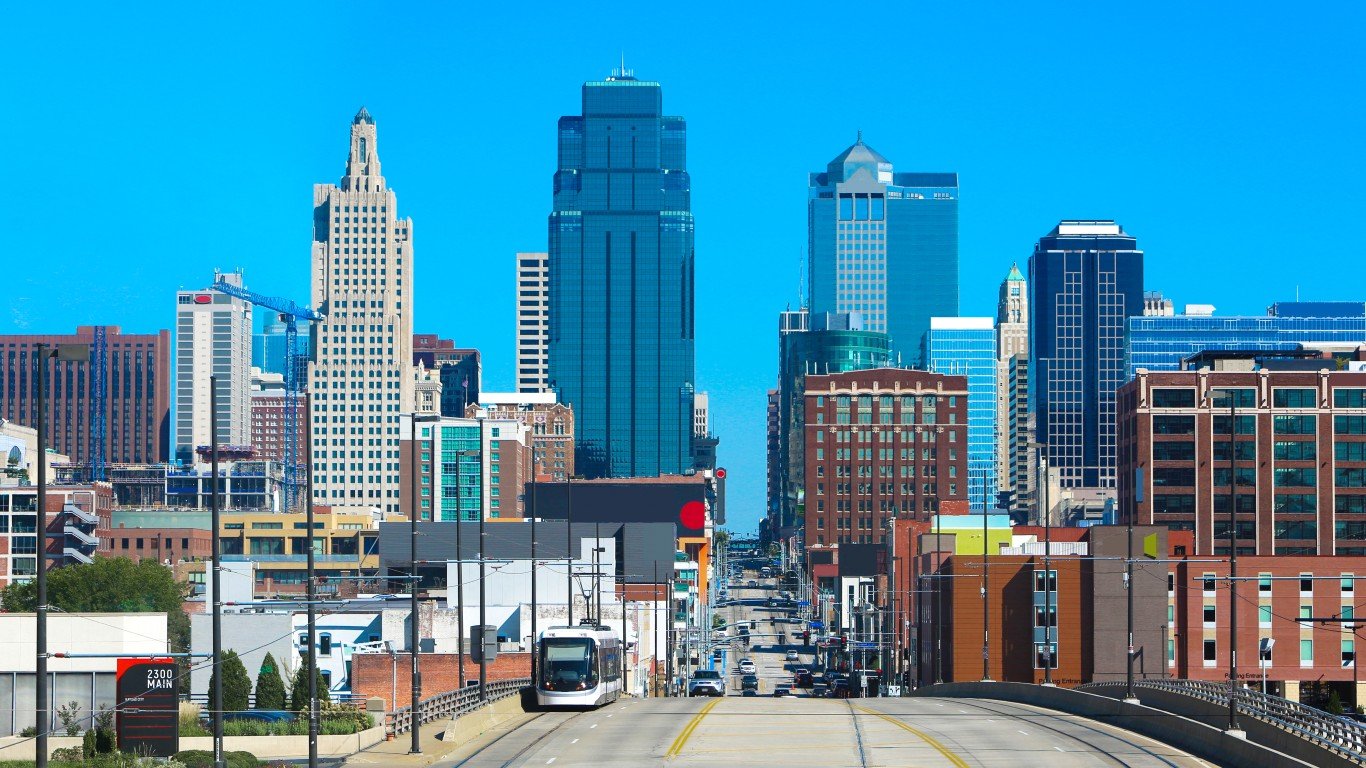
- Documented police killings, 2013-2023: 10.9 per 100,000 people (17 total)
- Cases where officers are known to have faced professional/criminal/civil consequences: 0
- Gender of those killed: 100% male
- Race/ethnicity of those killed: 47.1% White, 23.5% Black, 23.5% Hispanic, 0% Asian, 0% Native American
- Share of those killed with signs of a mental illness: 0%
- Share of those killed who were unarmed: 11.8%
- Population: 155,745
23. Topeka, KS
- Documented police killings, 2013-2023: 11.0 per 100,000 people (14 total)
- Cases where officers are known to have faced professional/criminal/civil consequences: 0
- Gender of those killed: 100% male
- Race/ethnicity of those killed: 42.9% White, 35.7% Black, 14.3% Hispanic, 0% Asian, 0% Native American
- Share of those killed with signs of a mental illness: 14.3%
- Share of those killed who were unarmed: 0%
- Population: 126,802
22. Tempe, AZ

- Documented police killings, 2013-2023: 11.2 per 100,000 people (20 total)
- Cases where officers are known to have faced professional/criminal/civil consequences: 0
- Gender of those killed: 95.0% male, 5.0% female
- Race/ethnicity of those killed: 15.0% White, 25.0% Black, 40% Hispanic, 0% Asian, 5.0% Native American
- Share of those killed with signs of a mental illness: 10%
- Share of those killed who were unarmed: 25.0%
- Population: 178,862
21. Greeley, CO
- Documented police killings, 2013-2023: 11.2 per 100,000 people (12 total)
- Cases where officers are known to have faced professional/criminal/civil consequences: 0
- Gender of those killed: 100% male
- Race/ethnicity of those killed: 8.3% White, 0% Black, 83.3% Hispanic, 0% Asian, 0% Native American
- Share of those killed with signs of a mental illness: 8.3%
- Share of those killed who were unarmed: 8.3%
- Population: 107,014
20. Savannah, GA
- Documented police killings, 2013-2023: 11.5 per 100,000 people (17 total)
- Cases where officers are known to have faced professional/criminal/civil consequences: 0
- Gender of those killed: 94.1% male, 5.9% female
- Race/ethnicity of those killed: 17.6% White, 64.7% Black, 0% Hispanic, 0% Asian, 0% Native American
- Share of those killed with signs of a mental illness: 0%
- Share of those killed who were unarmed: 5.9%
- Population: 147,930
19. Spokane, WA

- Documented police killings, 2013-2023: 11.5 per 100,000 people (26 total)
- Cases where officers are known to have faced professional/criminal/civil consequences: 3
- Gender of those killed: 96.2% male, 3.8% female
- Race/ethnicity of those killed: 69.2% White, 3.8% Black, 0% Hispanic, 0% Asian, 7.7% Native American
- Share of those killed with signs of a mental illness: 7.7%
- Share of those killed who were unarmed: 7.7%
- Population: 225,709
18. Dayton, OH
- Documented police killings, 2013-2023: 11.6 per 100,000 people (16 total)
- Cases where officers are known to have faced professional/criminal/civil consequences: 0
- Gender of those killed: 87.5% male, 12.5% female
- Race/ethnicity of those killed: 50% White, 50% Black, 0% Hispanic, 0% Asian, 0% Native American
- Share of those killed with signs of a mental illness: 18.8%
- Share of those killed who were unarmed: 0%
- Population: 138,416
17. San Bernardino, CA
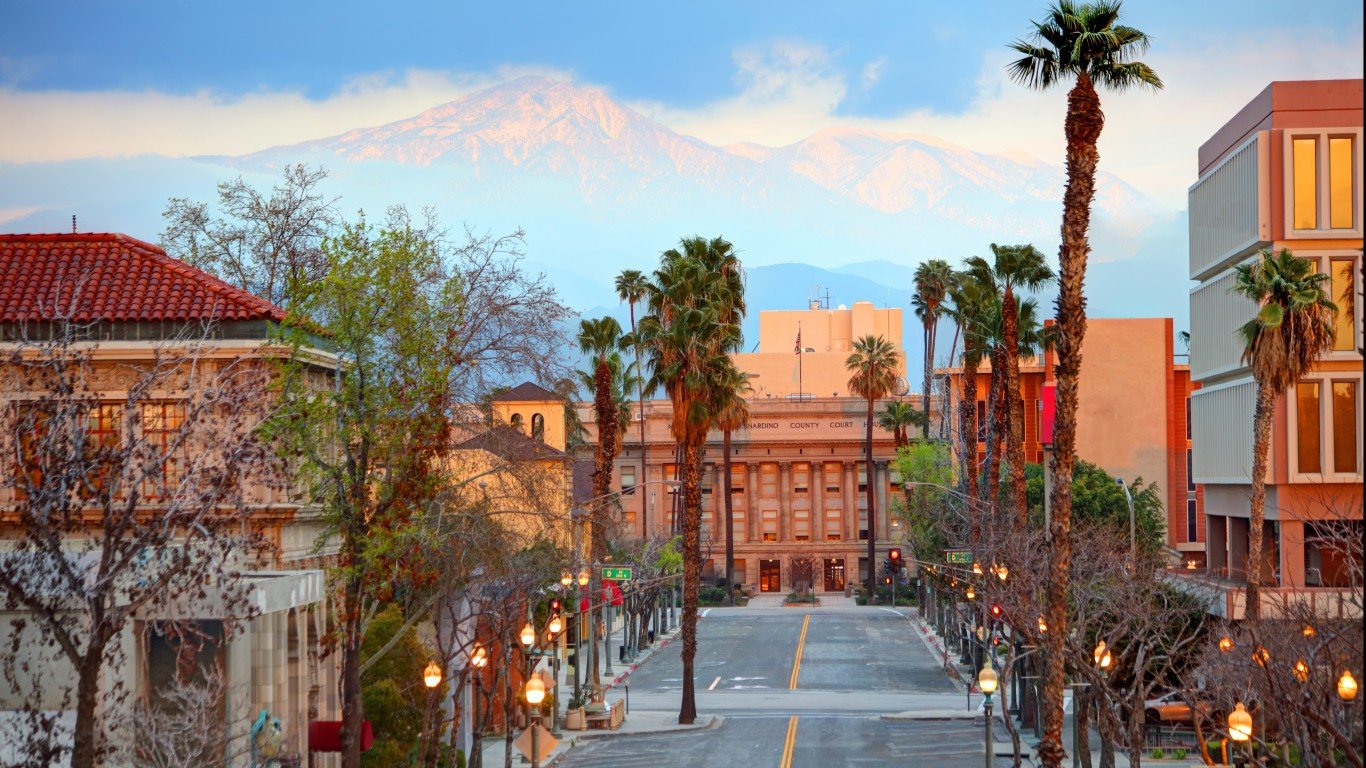
- Documented police killings, 2013-2023: 11.8 per 100,000 people (26 total)
- Cases where officers are known to have faced professional/criminal/civil consequences: 1
- Gender of those killed: 100% male
- Race/ethnicity of those killed: 23.1% White, 11.5% Black, 38.5% Hispanic, 3.8% Asian, 0% Native American
- Share of those killed with signs of a mental illness: 7.7%
- Share of those killed who were unarmed: 3.8%
- Population: 220,821
16. Lakeland, FL

- Documented police killings, 2013-2023: 11.8 per 100,000 people (13 total)
- Cases where officers are known to have faced professional/criminal/civil consequences: 0
- Gender of those killed: 92.3% male, 7.7% female
- Race/ethnicity of those killed: 61.5% White, 15.4% Black, 7.7% Hispanic, 0% Asian, 0% Native American
- Share of those killed with signs of a mental illness: 38.5%
- Share of those killed who were unarmed: 0%
- Population: 110,401
15. Evansville, IN
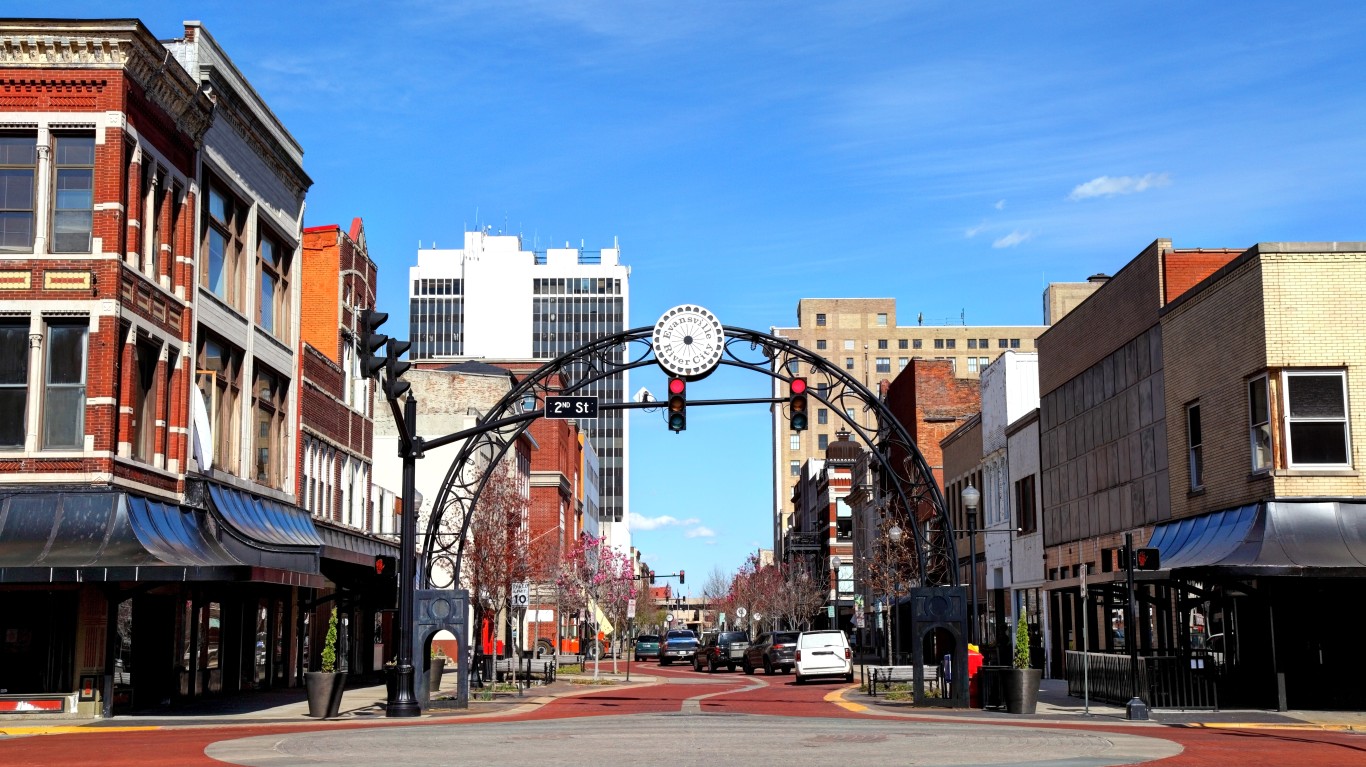
- Documented police killings, 2013-2023: 11.9 per 100,000 people (14 total)
- Cases where officers are known to have faced professional/criminal/civil consequences: 1
- Gender of those killed: 100% male
- Race/ethnicity of those killed: 57.1% White, 14.3% Black, 14.3% Hispanic, 0% Asian, 0% Native American
- Share of those killed with signs of a mental illness: 35.7%
- Share of those killed who were unarmed: 21.4%
- Population: 117,184
14. Sparks, NV

- Documented police killings, 2013-2023: 12.2 per 100,000 people (13 total)
- Cases where officers are known to have faced professional/criminal/civil consequences: 0
- Gender of those killed: 92.3% male, 7.7% female
- Race/ethnicity of those killed: 30.8% White, 7.7% Black, 46.2% Hispanic, 0% Asian, 7.7% Native American
- Share of those killed with signs of a mental illness: 23.1%
- Share of those killed who were unarmed: 0%
- Population: 106,900
13. Tulsa, OK

- Documented police killings, 2013-2023: 12.4 per 100,000 people (51 total)
- Cases where officers are known to have faced professional/criminal/civil consequences: 5
- Gender of those killed: 96.1% male, 3.9% female
- Race/ethnicity of those killed: 51.0% White, 25.5% Black, 13.7% Hispanic, 2.0% Asian, 0% Native American
- Share of those killed with signs of a mental illness: 21.6%
- Share of those killed who were unarmed: 21.6%
- Population: 410,652
12. Tucson, AZ
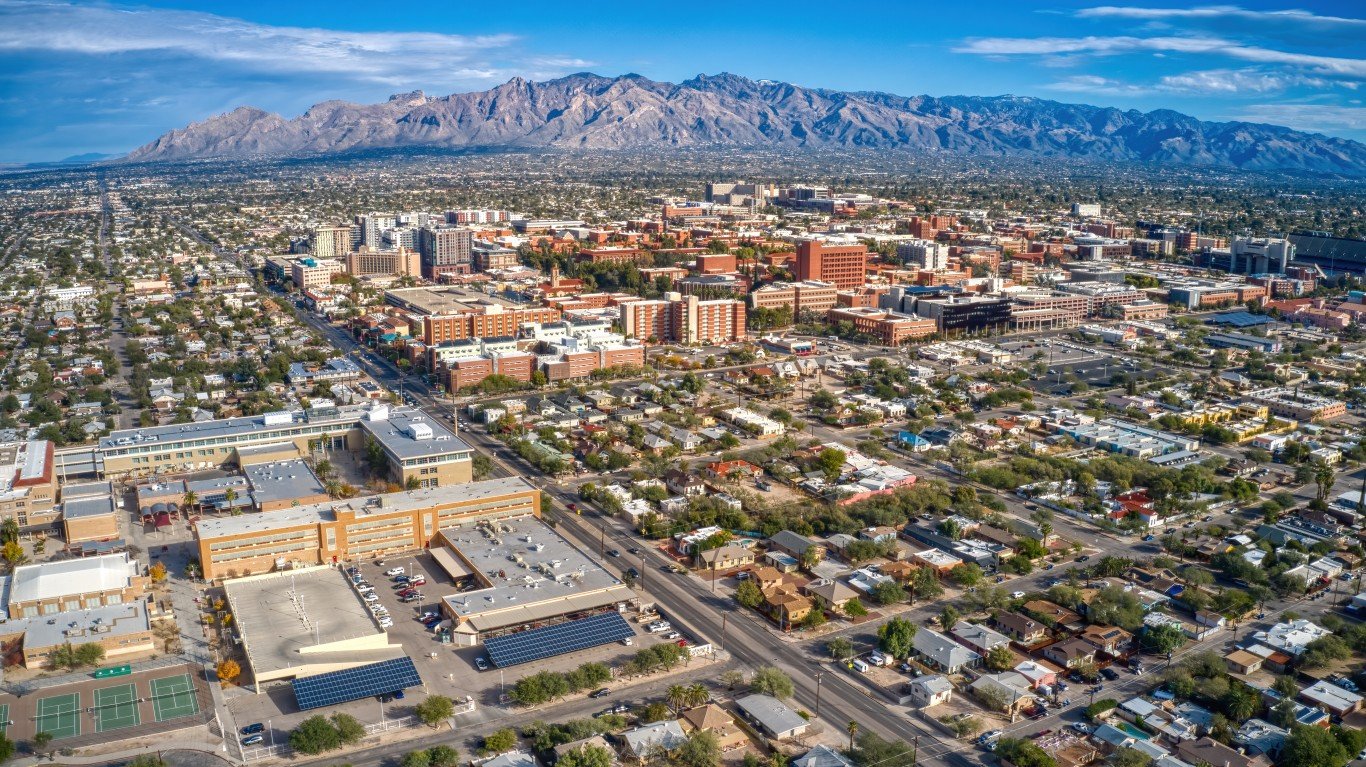
- Documented police killings, 2013-2023: 12.4 per 100,000 people (67 total)
- Cases where officers are known to have faced professional/criminal/civil consequences: 2
- Gender of those killed: 95.5% male, 4.5% female
- Race/ethnicity of those killed: 28.4% White, 13.4% Black, 41.8% Hispanic, 0% Asian, 0% Native American
- Share of those killed with signs of a mental illness: 20.9%
- Share of those killed who were unarmed: 11.9%
- Population: 538,167
11. Orlando, FL
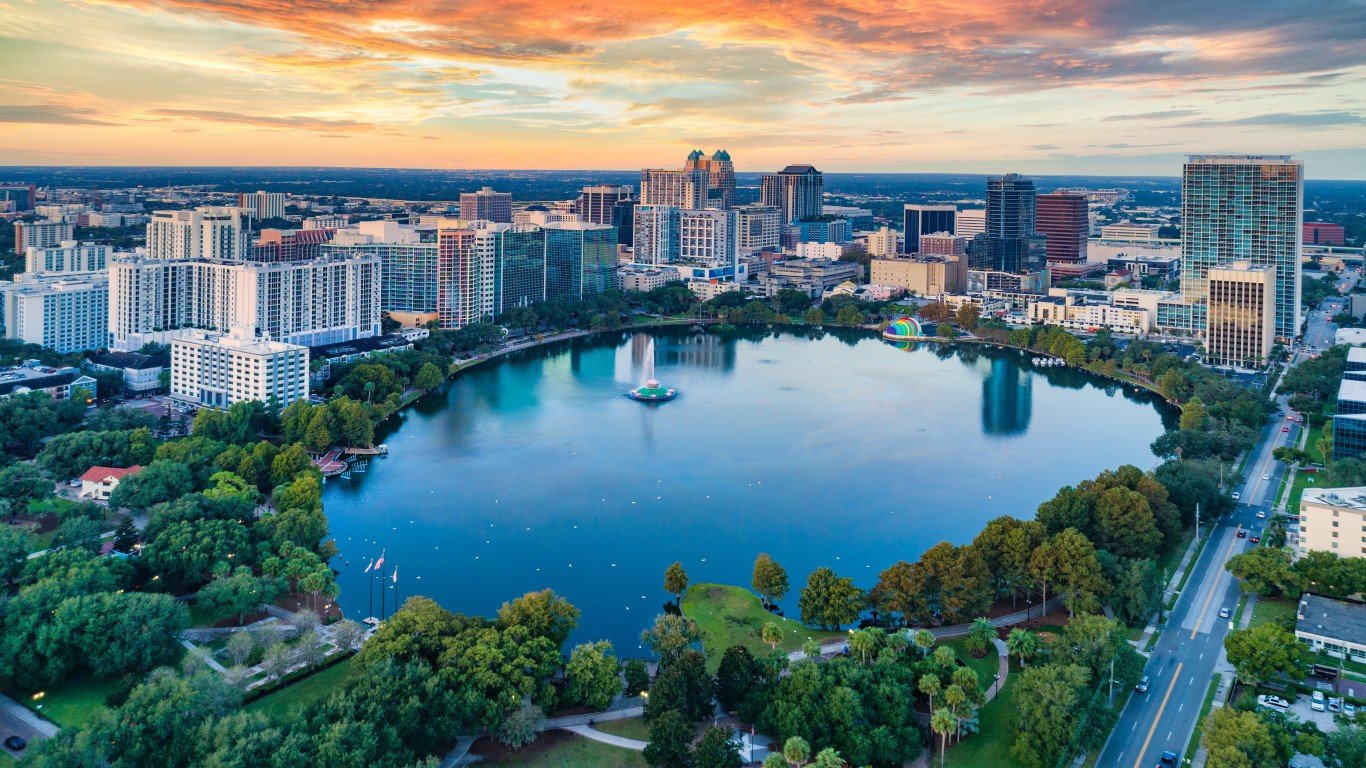
- Documented police killings, 2013-2023: 12.9 per 100,000 people (39 total)
- Cases where officers are known to have faced professional/criminal/civil consequences: 1
- Gender of those killed: 94.9% male, 5.1% female
- Race/ethnicity of those killed: 25.6% White, 51.3% Black, 17.9% Hispanic, 2.6% Asian, 0% Native American
- Share of those killed with signs of a mental illness: 17.9%
- Share of those killed who were unarmed: 17.9%
- Population: 302,968
10. Springfield, MO
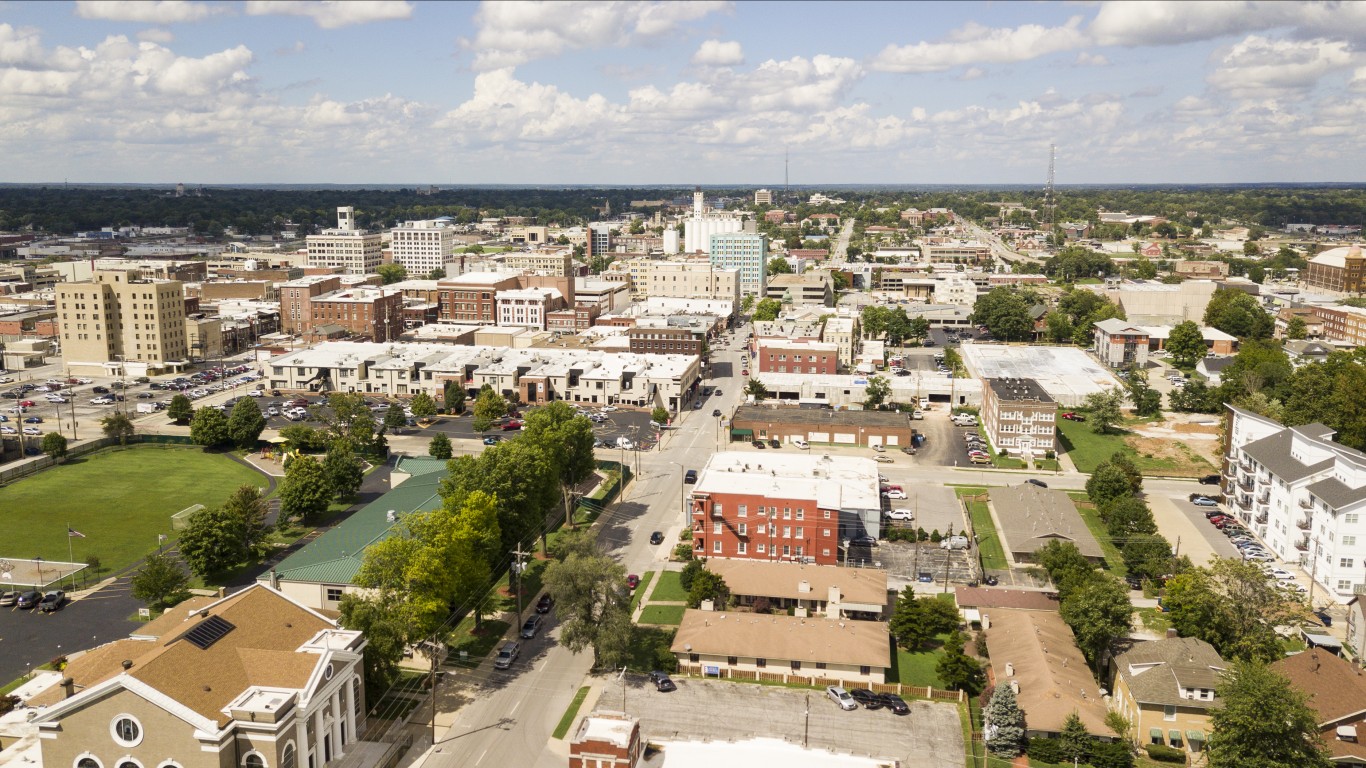
- Documented police killings, 2013-2023: 13.0 per 100,000 people (22 total)
- Cases where officers are known to have faced professional/criminal/civil consequences: 0
- Gender of those killed: 95.5% male, 4.5% female
- Race/ethnicity of those killed: 59.1% White, 4.5% Black, 0% Hispanic, 0% Asian, 0% Native American
- Share of those killed with signs of a mental illness: 13.6%
- Share of those killed who were unarmed: 9.1%
- Population: 168,603
9. Las Vegas, NV
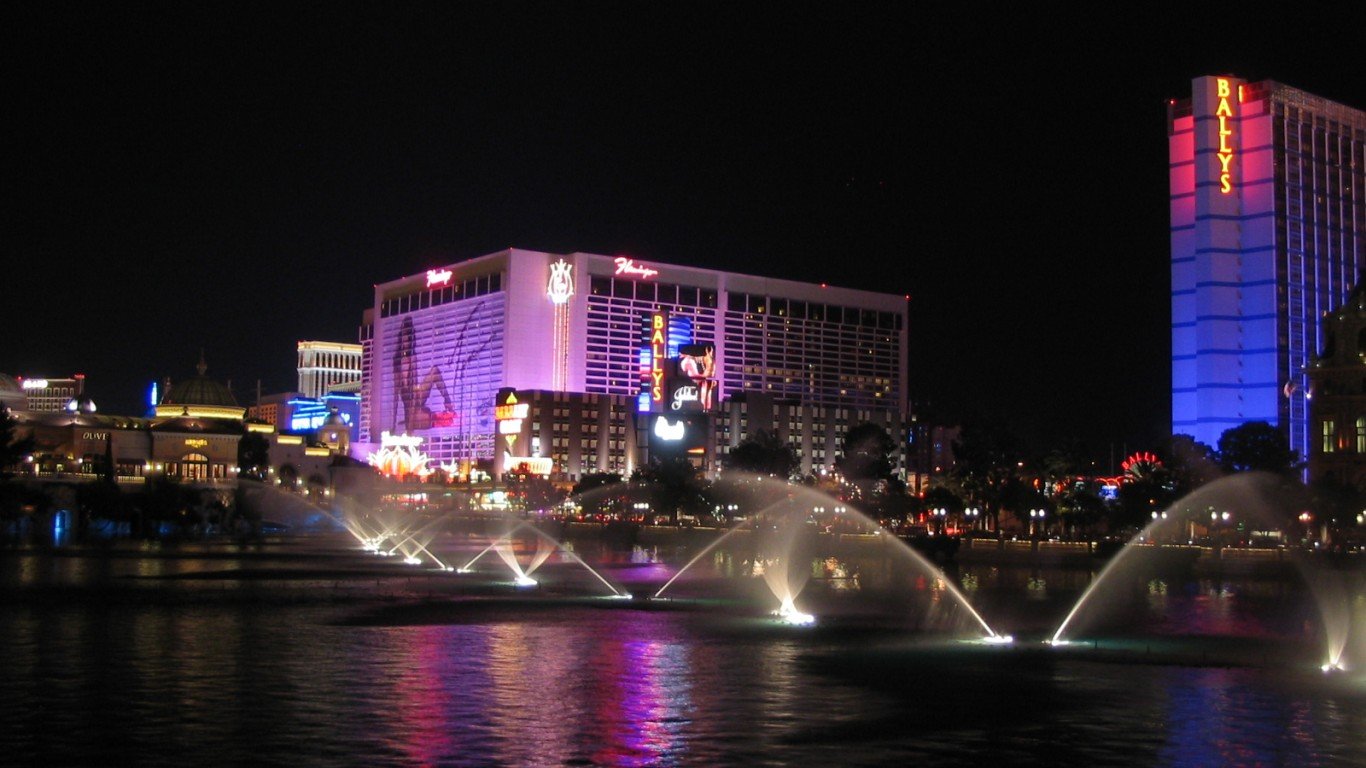
- Documented police killings, 2013-2023: 13.2 per 100,000 people (84 total)
- Cases where officers are known to have faced professional/criminal/civil consequences: 3
- Gender of those killed: 95.2% male, 4.8% female
- Race/ethnicity of those killed: 41.7% White, 21.4% Black, 25.0% Hispanic, 1.2% Asian, 1.2% Native American
- Share of those killed with signs of a mental illness: 28.6%
- Share of those killed who were unarmed: 10.7%
- Population: 634,786
8. Bakersfield, CA
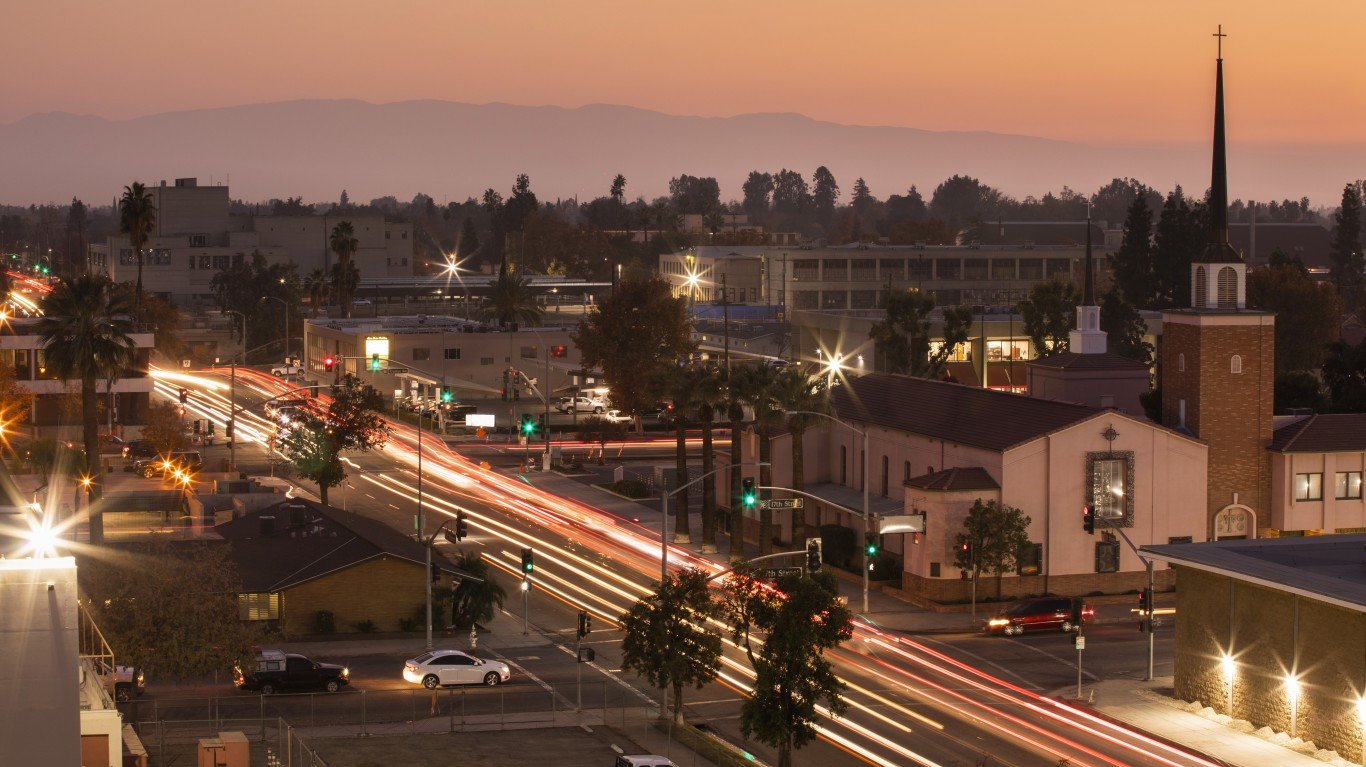
- Documented police killings, 2013-2023: 13.5 per 100,000 people (54 total)
- Cases where officers are known to have faced professional/criminal/civil consequences: 5
- Gender of those killed: 94.4% male, 5.6% female
- Race/ethnicity of those killed: 20.4% White, 7.4% Black, 64.8% Hispanic, 1.9% Asian, 0% Native American
- Share of those killed with signs of a mental illness: 13.0%
- Share of those killed who were unarmed: 24.1%
- Population: 398,756
7. Miami, FL
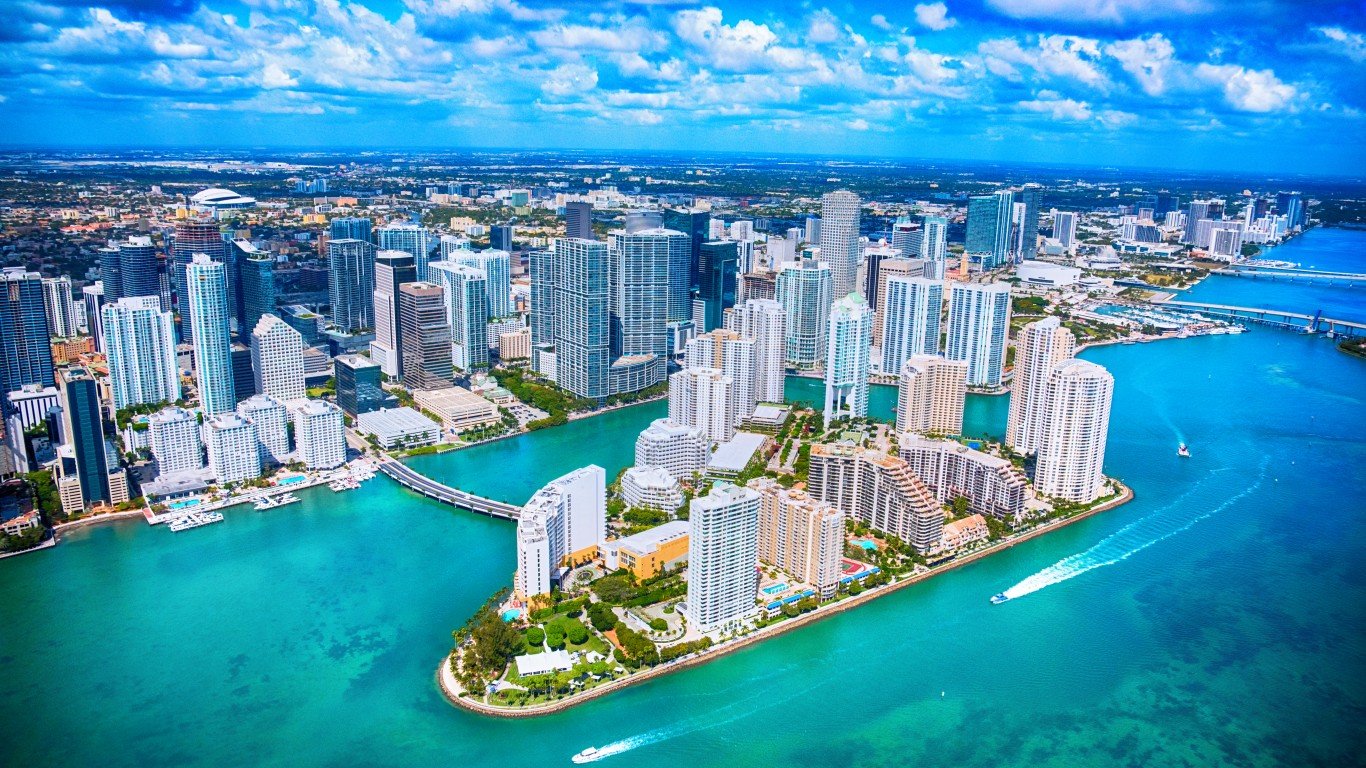
- Documented police killings, 2013-2023: 13.8 per 100,000 people (61 total)
- Cases where officers are known to have faced professional/criminal/civil consequences: 1
- Gender of those killed: 96.7% male, 3.3% female
- Race/ethnicity of those killed: 9.8% White, 32.8% Black, 47.5% Hispanic, 0% Asian, 0% Native American
- Share of those killed with signs of a mental illness: 14.8%
- Share of those killed who were unarmed: 13.1%
- Population: 440,807
6. Salt Lake City, UT

- Documented police killings, 2013-2023: 14.1 per 100,000 people (28 total)
- Cases where officers are known to have faced professional/criminal/civil consequences: 0
- Gender of those killed: 92.9% male, 7.1% female
- Race/ethnicity of those killed: 50% White, 17.9% Black, 14.3% Hispanic, 0% Asian, 3.6% Native American
- Share of those killed with signs of a mental illness: 17.9%
- Share of those killed who were unarmed: 10.7%
- Population: 199,153
5. Albuquerque, NM
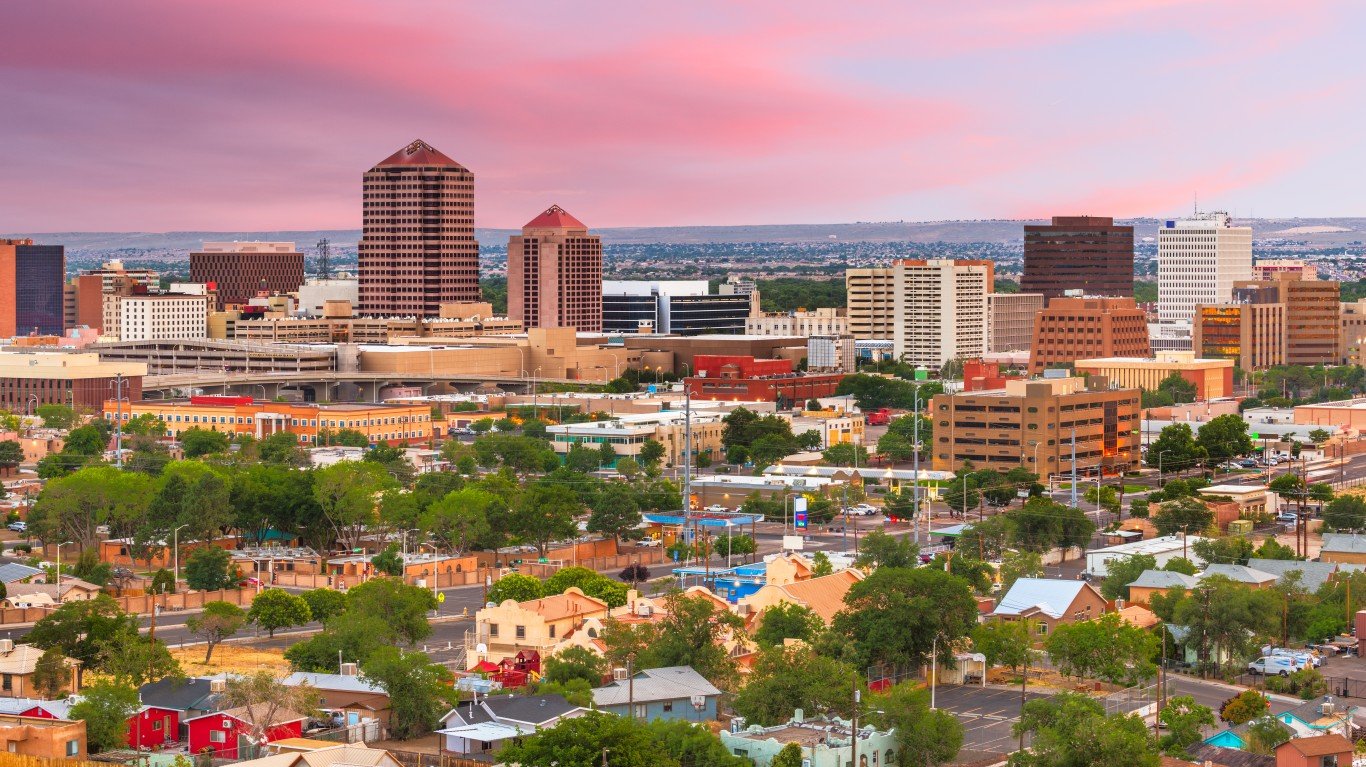
- Documented police killings, 2013-2023: 14.4 per 100,000 people (81 total)
- Cases where officers are known to have faced professional/criminal/civil consequences: 1
- Gender of those killed: 96.3% male, 3.7% female
- Race/ethnicity of those killed: 28.4% White, 9.9% Black, 51.9% Hispanic, 0% Asian, 1.2% Native American
- Share of those killed with signs of a mental illness: 22.2%
- Share of those killed who were unarmed: 9.9%
- Population: 562,336
4. Billings, MT
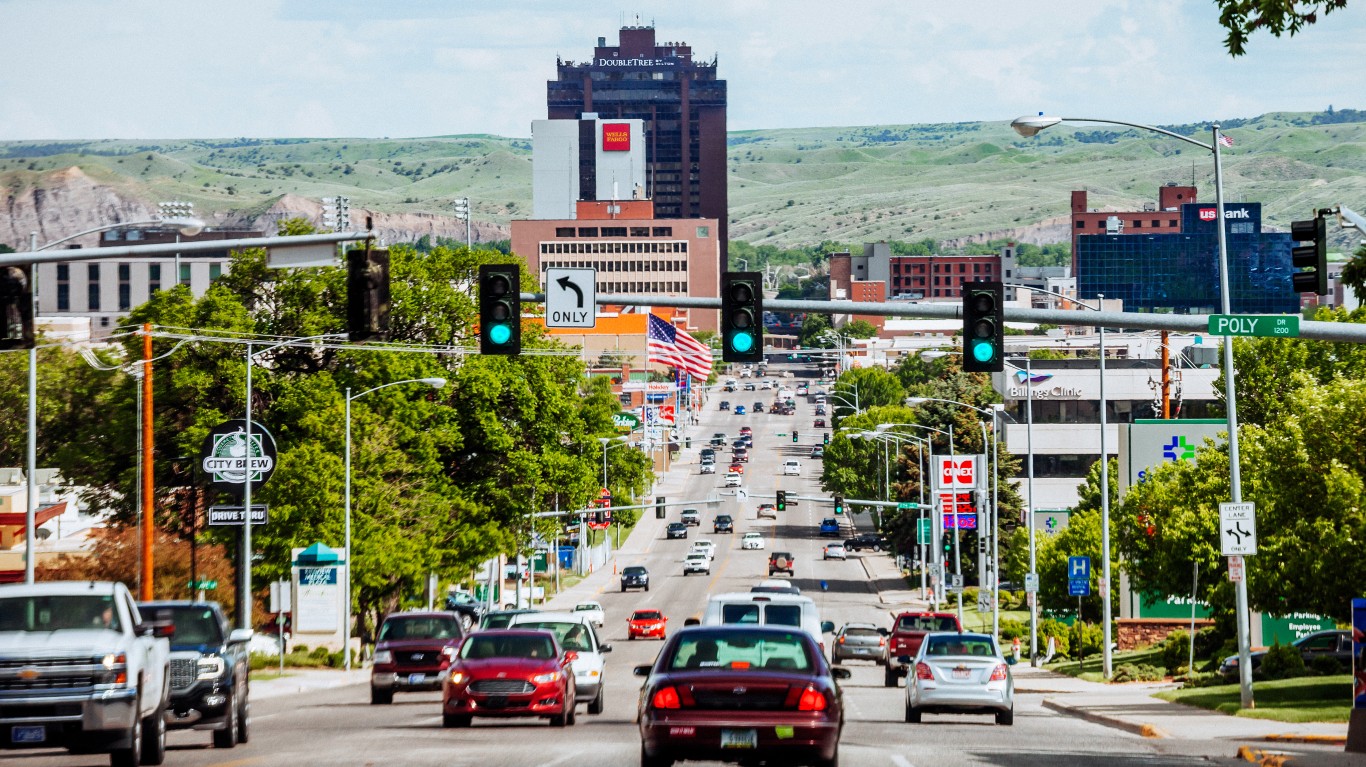
- Documented police killings, 2013-2023: 16.4 per 100,000 people (19 total)
- Cases where officers are known to have faced professional/criminal/civil consequences: 0
- Gender of those killed: 94.7% male, 5.3% female
- Race/ethnicity of those killed: 68.4% White, 5.3% Black, 5.3% Hispanic, 0% Asian, 21.1% Native American
- Share of those killed with signs of a mental illness: 15.8%
- Share of those killed who were unarmed: 15.8%
- Population: 115,689
3. St. Louis, MO
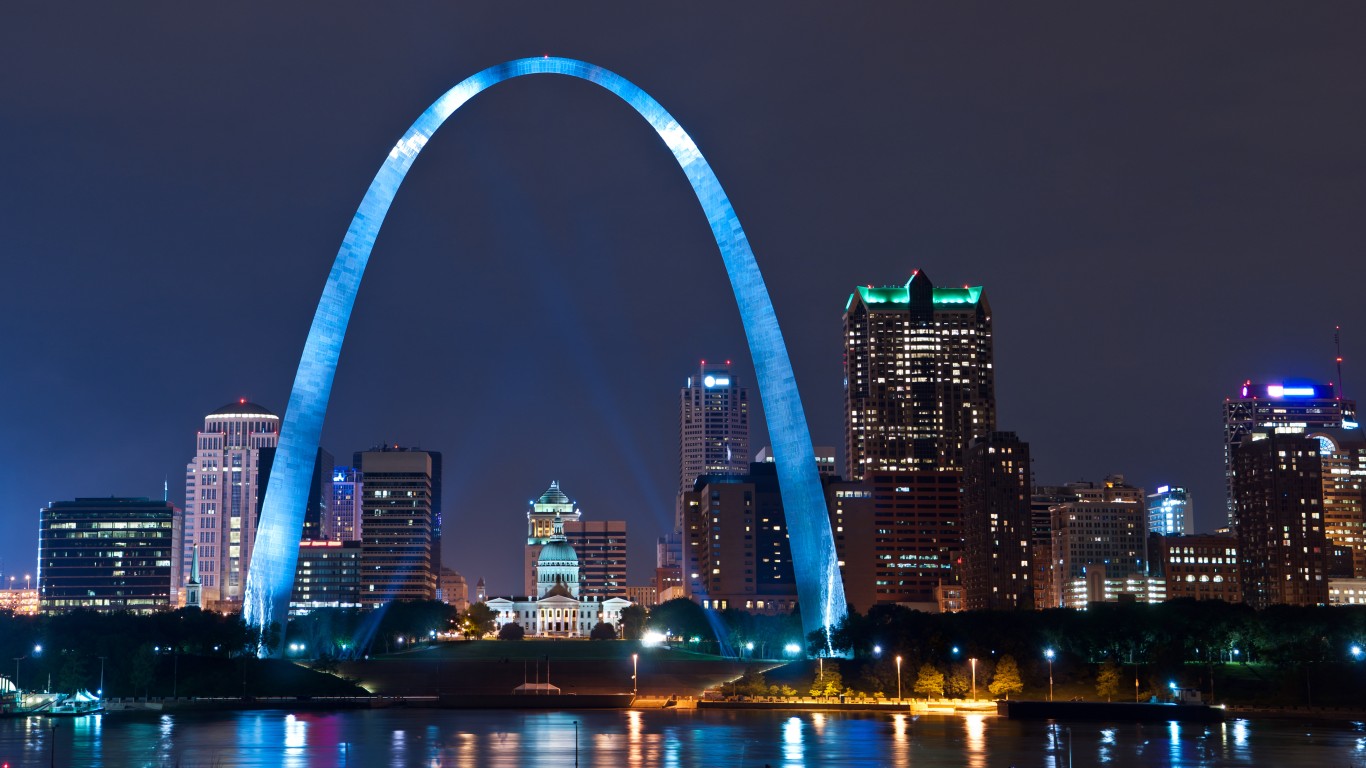
- Documented police killings, 2013-2023: 18.2 per 100,000 people (55 total)
- Cases where officers are known to have faced professional/criminal/civil consequences: 2
- Gender of those killed: 96.4% male, 3.6% female
- Race/ethnicity of those killed: 12.7% White, 80% Black, 1.8% Hispanic, 0% Asian, 0% Native American
- Share of those killed with signs of a mental illness: 12.7%
- Share of those killed who were unarmed: 10.9%
- Population: 302,787
2. Las Cruces, NM
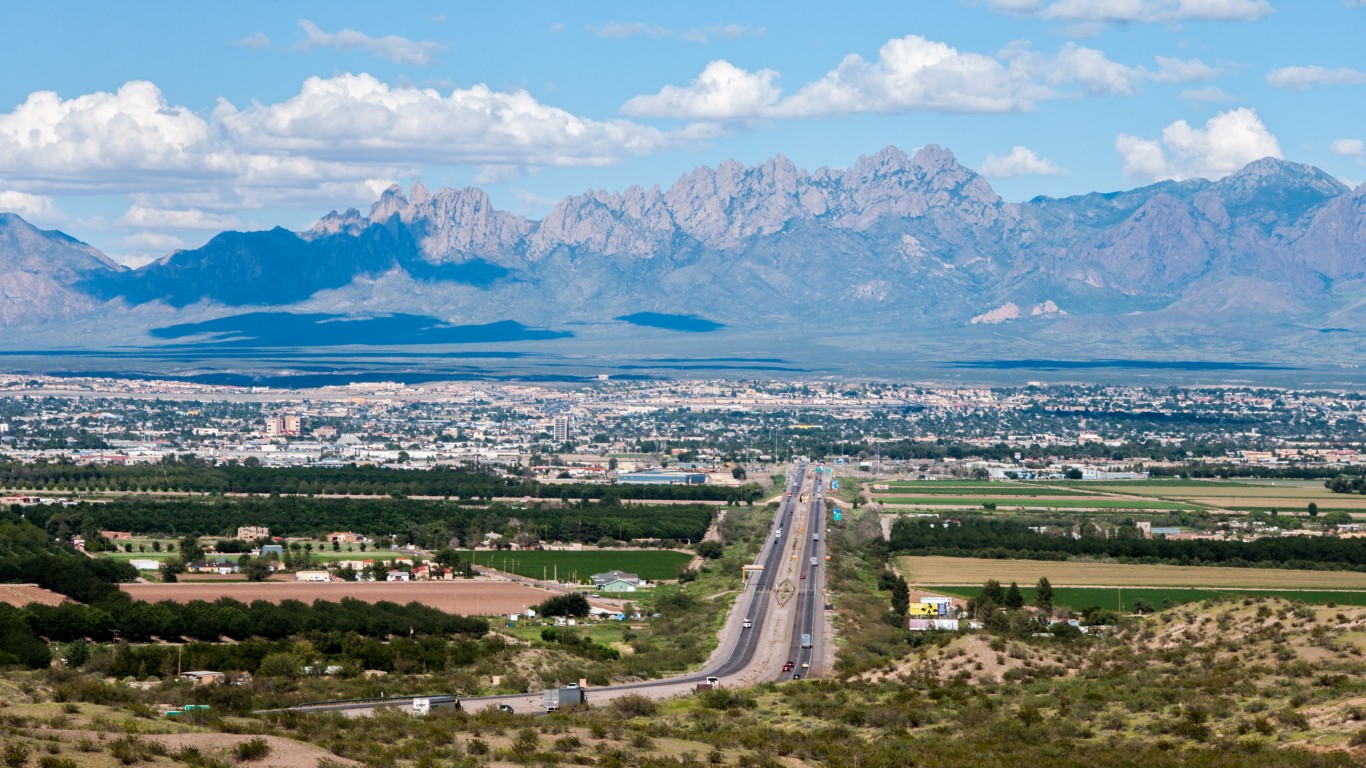
- Documented police killings, 2013-2023: 23.7 per 100,000 people (26 total)
- Cases where officers are known to have faced professional/criminal/civil consequences: 3
- Gender of those killed: 92.3% male, 7.7% female
- Race/ethnicity of those killed: 15.4% White, 0% Black, 65.4% Hispanic, 3.8% Asian, 0% Native American
- Share of those killed with signs of a mental illness: 23.1%
- Share of those killed who were unarmed: 7.7%
- Population: 109,934
1. Pueblo, CO

- Documented police killings, 2013-2023: 26.0 per 100,000 people (29 total)
- Cases where officers are known to have faced professional/criminal/civil consequences: 0
- Gender of those killed: 96.6% male, 3.4% female
- Race/ethnicity of those killed: 27.6% White, 3.4% Black, 48.3% Hispanic, 0% Asian, 3.4% Native American
- Share of those killed with signs of a mental illness: 6.9%
- Share of those killed who were unarmed: 10.3%
- Population: 111,424
Methodology
To identify the cities where the most people are killed by law enforcement, 24/7 Wall St. reviewed data from Mapping Police Violence, a research collaborative that collects data on police killings across the nation from the country’s three largest comprehensive and impartial crowdsourced databases. We only considered cities with populations of at least 100,000 people.
Cities were ranked by the number of reported police killings from the beginning of 2013 through the end of May 2023 for every 100,000 people. Population data used to calculate the number of killings per 100,000 came from the U.S. Census Bureau’s 2021 American Community Survey. The total number of killings includes those carried out by off-duty law enforcement officers.
All supplemental data came from the Mapping Police Violence database, including demographic data on the gender and race or ethnicity of those killed, the share of those killed who showed signs of mental illness, killings by specific law enforcement agencies, and the share of those killed who were armed, whether with a firearm, edged weapon, blunt object, or vehicle.
Law enforcement officers involved in these cases were only considered to have faced official consequences if they are known to have been charged with a crime (regardless of whether or not they were convicted), sued in civil court, fired, ticketed, or put on leave.
Cases in which an investigation is still pending, or where the actions of a law enforcement officer were deemed justified by a grand jury or official state or local attorney were not counted among the total cases that resulted in official consequences.
Sponsored: Tips for Investing
A financial advisor can help you understand the advantages and disadvantages of investment properties. Finding a qualified financial advisor doesn’t have to be hard. SmartAsset’s free tool matches you with up to three financial advisors who serve your area, and you can interview your advisor matches at no cost to decide which one is right for you. If you’re ready to find an advisor who can help you achieve your financial goals, get started now.
Investing in real estate can diversify your portfolio. But expanding your horizons may add additional costs. If you’re an investor looking to minimize expenses, consider checking out online brokerages. They often offer low investment fees, helping you maximize your profit.
The post The US City Where Police Have Killed the Most People in the Past Decade appeared first on 24/7 Wall St..